Tag: Visualization
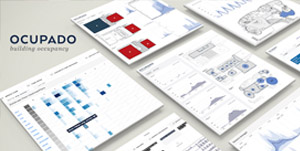
Ocupado: Visual Analysis of Building Occupancy using WiFi Data
In a multi-year visualization design study, we created and evaluated a set of visual decision-support tools centered around occupancy data for stakeholders in facilities management and planning. Ocupado uses WiFi devices as a proxy for human presence, capturing location-based counts that preserve privacy without trajectories.
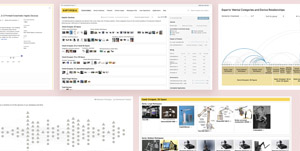
The Haptipedia Project
Haptipedia aims to close the gap between device and interaction designers, accelerate design exploration, and reduce fruitless reinventions. We accomplish this by exposing decades of haptic device inventions that have been buried in the literature and making them easy to search and compare through an open-source visualization and database.
Bike Sharing Atlas
The interactive visualization system bikesharingatlas.org supports the explorative data analysis of more than 460 bike-sharing networks worldwide. Being increasingly digitized, these networks nowadays produce data that can reveal interesting insights, not only into patterns of bicycle usage but also underlying spatio-temporal dynamics of a city.
Visualize Distributed Logs At Scale
VectorVis is a tool that enables interactive exploration of distributed system logs with coordinated views at the detail and summary level.
Vienna City Explorer
An interactive web-based visualization that supports geo-related open data from Vienna.
VizCommender: Computing Text-Based Topic Similarity in Visualization Repositories for Content-Based Recommendations
We present the concept of a text-based topic similarity measure to be used towards content-based recommendations in visualization repositories. We investigate four applicable NLP models and conduct a user study that demonstrates it is possible to obtain good alignment between human similarity perception and off-the-shelf model predictions.
Data-First Visualization Design Studies
We introduce the notion of a data-first design study which is triggered by the acquisition of real-world data instead of specific stakeholder analysis questions. We propose an adaptation of the design study methodology framework to provide practical guidance and to aid transferability to other data-first design processes.
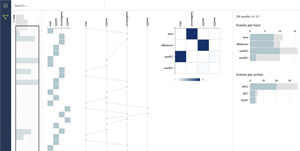
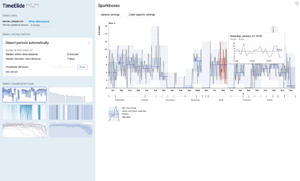
TimeElide: Visual Analysis of Non-Contiguous Time Series Slices
TimeElide is a visual analysis tool for the novel data abstraction of non-contiguous time series slices, namely time intervals that contain a sequence of time-value pairs but are not adjacent to each other. This abstraction is relevant for analysis tasks where time periods of interest are known in advance or inferred from the data, rather than discovered through open-ended visual exploration.
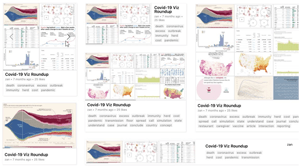
VizSnippets: Compressing Visualization Bundles Into Representative Previews for Browsing Visualization Collections
The VizSnippets computational pipeline compresses the visual and textual content of bundles into representative previews that is adaptive to a provided pixel budget and provides high information density with multiple images and carefully chosen keywords.
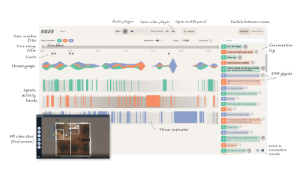
ROGER: Visualizing Voice Records to Enhance Team Communication Trainings for High-Stress Situations
A novel visual analytics interface designed to support afteraction reviews of communication during high-stress training scenarios. Developed in collaboration with police trainers through an iterative design study
