ROGER: Visualizing Voice Records to Enhance Team Communication Trainings for High-Stress Situations
Abstract
Effective communication is essential in high-stress environments
but stress often disrupts the flow of information and leads to miscommunication. While scenario-based training exercises are widely
used, post-hoc reflection and analysis of verbal interactions remain challenging due to overlapping speech, limited analysis time,
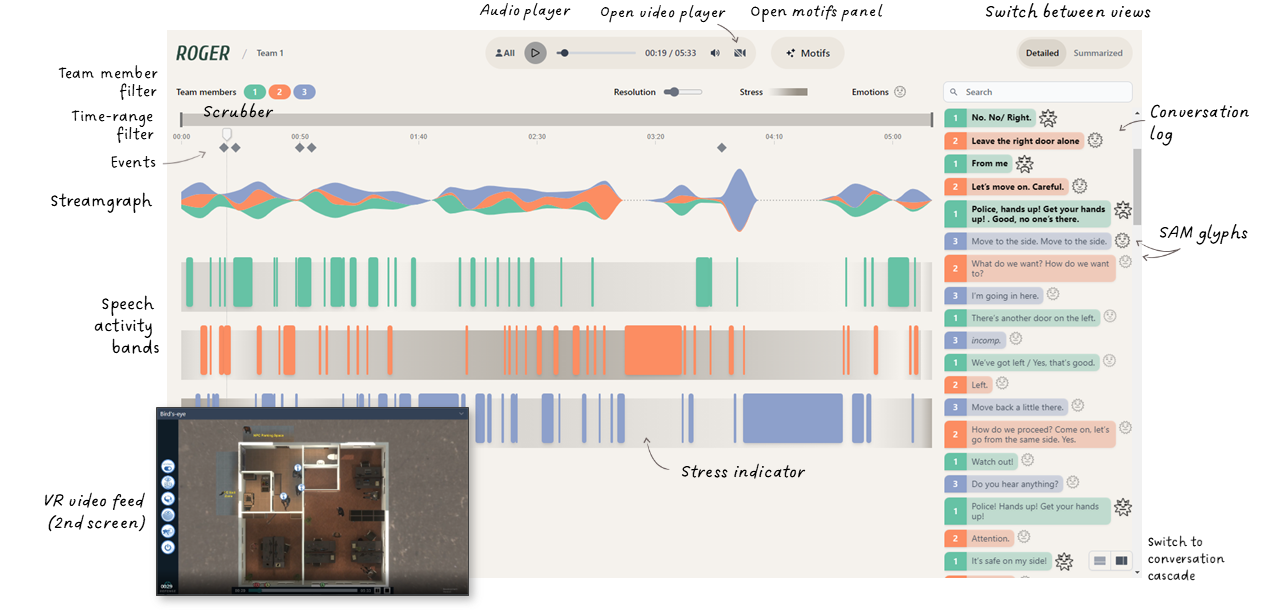
and the dynamic nature of these situations. This paper introduces
ROGER, a novel visual analytics interface designed to support afteraction reviews of communication during high-stress training scenarios. Developed in collaboration with police trainers through an
iterative design study, ROGER integrates emotional voice metrics,
heart rate variability, and spoken language content to provide a comprehensive analysis of team communication. The system enables a flexible in-depth exploration of communication patterns
through motifs—repeated sequences or content elements—including
those generated by a large language model (LLM) as well as predefined ones. Our approach addresses the limitations of existing
tools, which focus primarily on content summarization or voice
replays without incorporating emotional and stress-related voice
data. We validated the utility through interviews with police trainers and conducted a workshop with medical first responders to
investigate the potential for cross-domain applicability. Our findings provide preliminary evidence that ROGER supports effective
team performance analysis in diverse high-stress environments.
Publication
ROGER: Visualizing Voice Records to Enhance Team Communication Trainings for High-Stress Situations
Proc. Int. Symp. on Visual Information Communication and Interaction (VINCI), 2025
Proc. Int. Symp. on Visual Information Communication and Interaction (VINCI), 2025
Tags